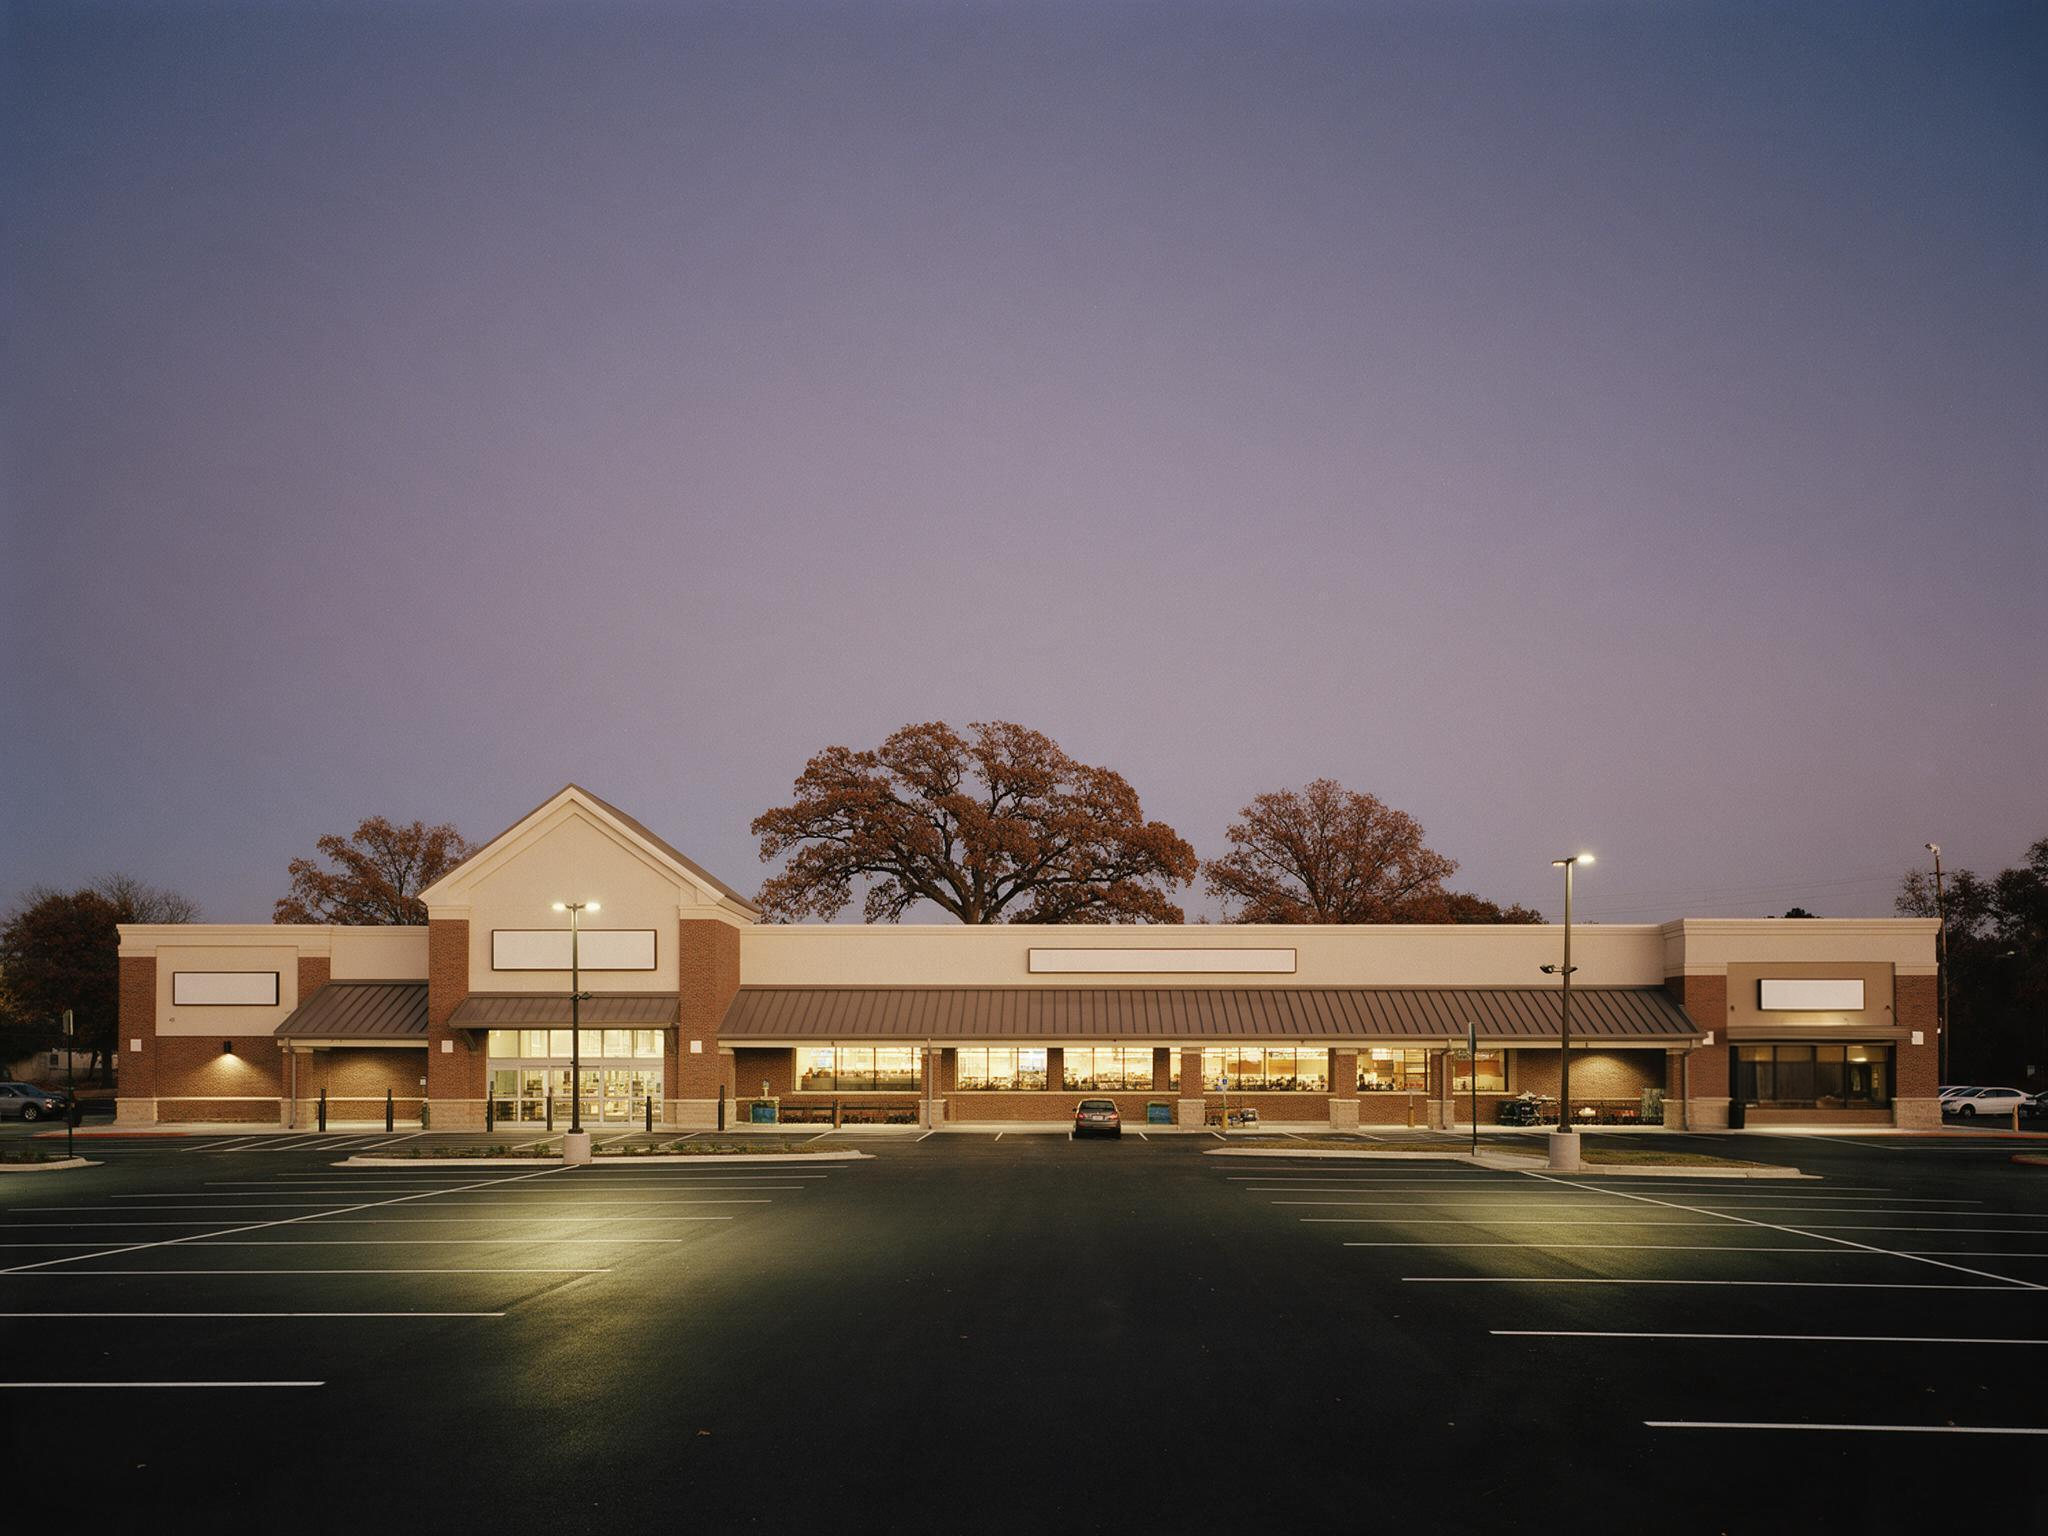
Stones River Commons
Five answers for one owner, about one center.
- 01The Center
A grocer that chose to stay, and 22,000 square feet of daily-needs shops that ride its traffic.04 - 02Broker Opinion of Value
$12,300,000. Two methods, one answer, $6,267 apart.07 - 03Track Record
Ten listings, six grocery-anchored centers, 8.9 offers on average.13 - 04The Marketing Plan
Launch January 12. Offers February 18. Close May 5.14 - 05Why Harpeth
The person who pitched you runs your deal.20
Prepared as of November 1, 2026 (sample). All remaining-term figures in this book are measured from that date. Every figure on every page traces to one model; no table in this book disagrees with another.
| Milestone | Date (sample) |
|---|---|
| Owner meeting / pitch | Thu, Nov 5, 2026 |
| Listing agreement executed | Fri, Nov 13, 2026 |
| Preparation: OM, data room, photography, buyer list | Nov 16, 2026 to Jan 8, 2027 |
| Launch | Tue, Jan 12, 2027 |
| Call for offers | Thu, Feb 18, 2027, 5:00 p.m. CT |
| Best-and-final round due | Thu, Feb 25, 2027 |
| Buyer selected | Mon, Mar 1, 2027 |
| Purchase and sale agreement executed | Fri, Mar 5, 2027 |
| Due diligence expires (30 days) | Mon, Apr 5, 2027 |
| Closing | Wed, May 5, 2027 |
Sample for demonstration only. All figures, the center, its tenants, the comparable sales, the track record and the dates in this book are illustrative samples. They are not a valuation of any actual property and describe no real transaction. The value shown is a Broker Opinion of Value prepared by a licensed real estate broker for listing and marketing purposes. It is not a certified valuation and should not be relied on for lending, tax, litigation or financial-reporting purposes.
We have spent the last three weeks on your center, not on a template.
We walked the lot on a Tuesday morning and a Saturday afternoon. We counted cars. We read the rent roll suite by suite, and we priced Stones River Commons against six grocery-anchored sales a buyer will actually put next to it. What follows is our Broker Opinion of Value, $12,300,000, the method behind it, and the plan we would run to beat it.
Two larger firms will also show you a number. Ask each of them the same three questions. Which comps did you use, and why those? Who runs my deal on a Tuesday in February? Which buyers will you call first, by name? We have written our answers down. They are in this book.
Stones River Commons
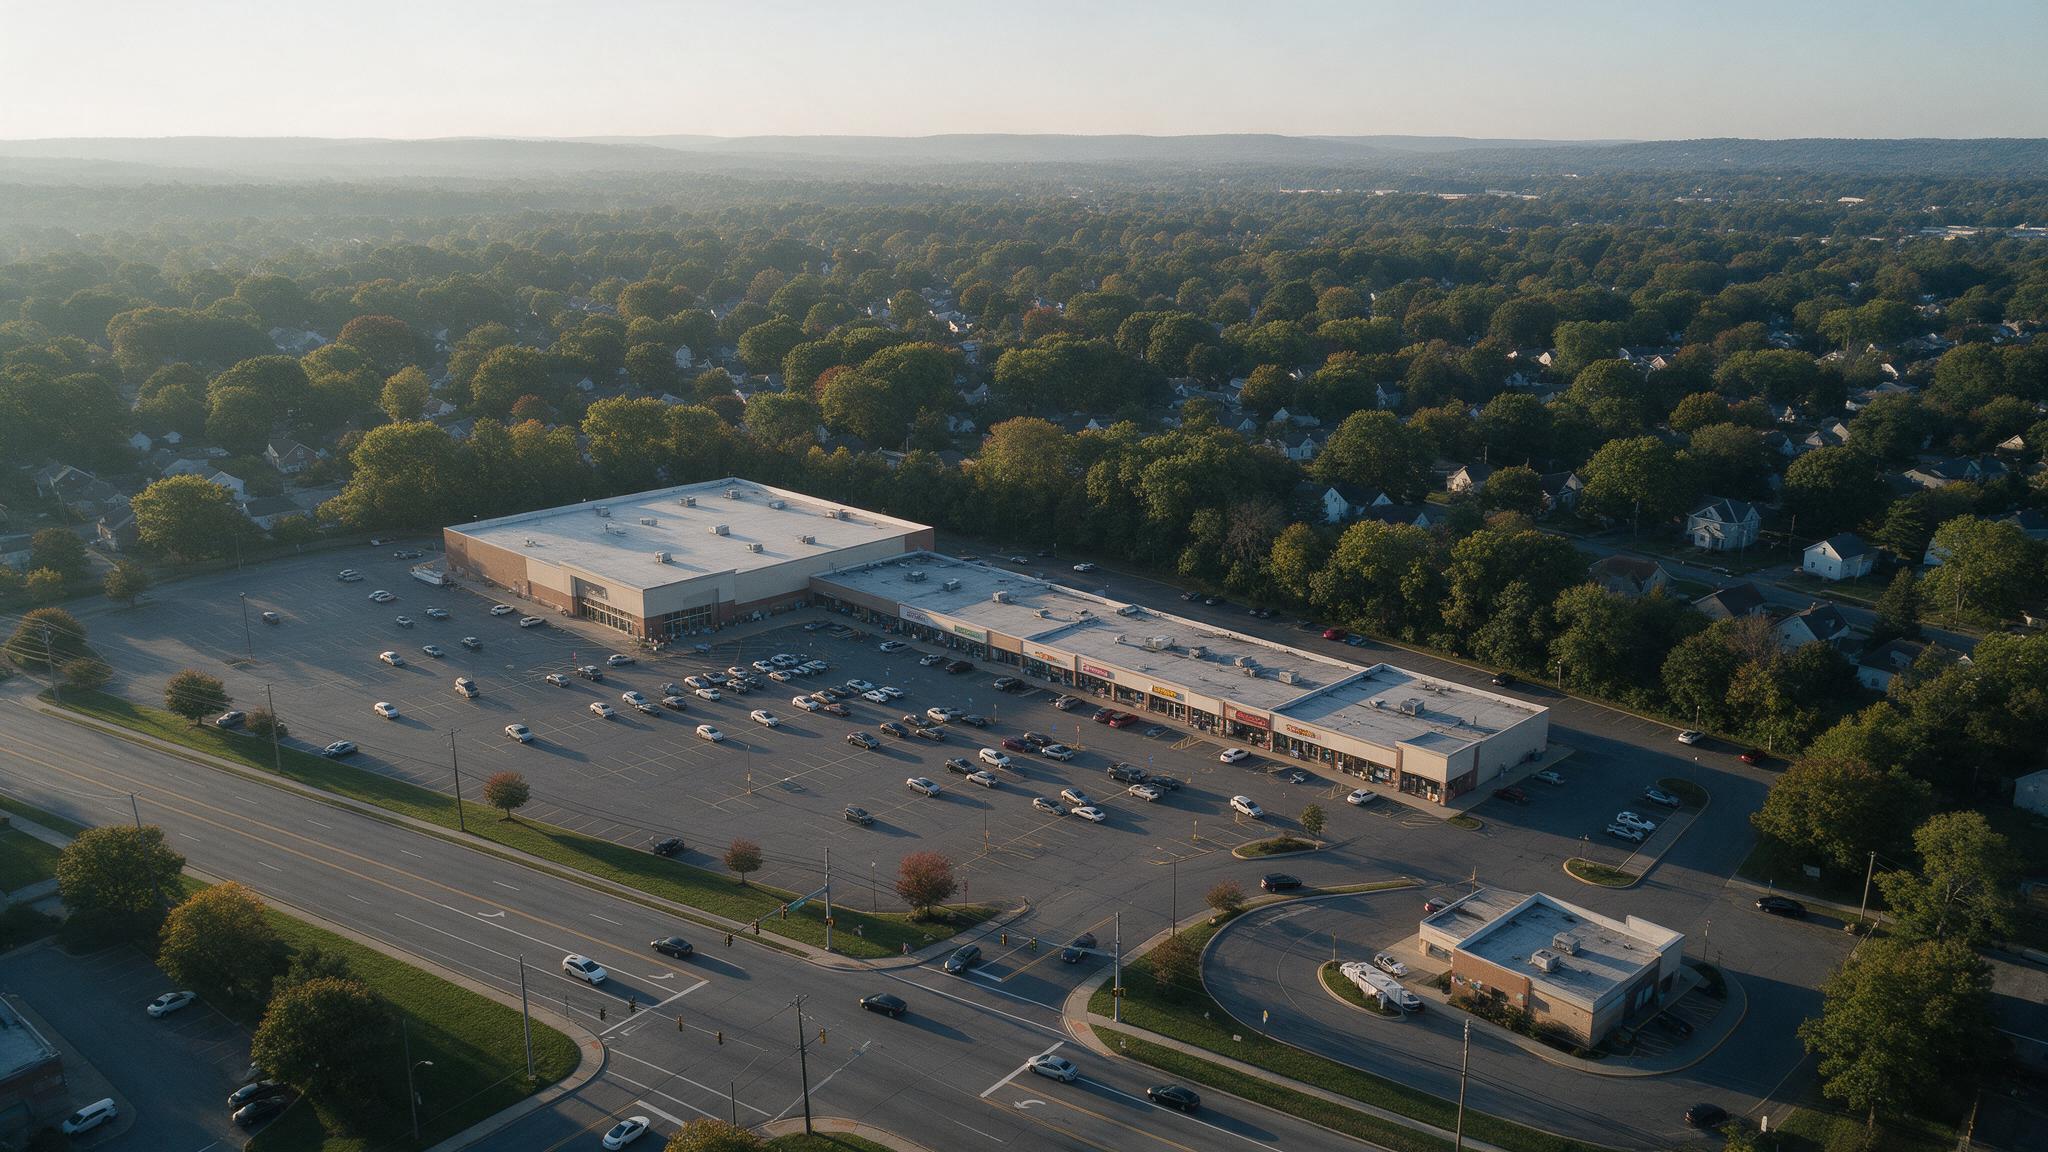
Trade area, 3-mile (sample)
East Davidson County rooftops on both sides of Lebanon Pike, and a cross corridor feeding the signal. The traffic is the argument: the OM leads with it, and the drone video shows it at a weekday peak.
The center at a glance
| Address | 4410 Lebanon Pike, Hermitage, TN 37076 (illustrative address) |
| Submarket | Hermitage / Lebanon Pike corridor, east Davidson County, Nashville MSA |
| Type | Grocery-anchored neighborhood center |
| GLA | 60,000 SF |
| Anchor GLA | 38,000 SF (63.3%) |
| Inline GLA | 22,000 SF (36.7%), 13 suites |
| Site area | 7.4 acres |
| Year built | 2007. Façade and storefront refresh 2021; anchor roof replaced 2019; inline roof 2007, coated 2022 |
| Parking | 312 surface spaces, 5.2 per 1,000 SF |
| Frontage & access | 640 ft on Lebanon Pike; signalized full-access entrance plus one right-in/right-out; pylon sign with 8 tenant panels |
| Occupancy | 96.7% overall (58,000 of 60,000 SF); anchor 100%; inline 90.9% (20,000 of 22,000 SF) |
| WALT | 6.44 years on occupied SF (anchor 7.83 years; inline 3.79 years) |
Fourteen suites on one line of frontage, read the way a buyer walks them.
Schematic site plan · not to scale · sample| Tenant | Cumberland Fresh Market, sample regional grocer: 64 stores across Tennessee, Kentucky and Alabama; privately held, no public rating; original tenant since 2007 |
| Lease type | NNN. Pro-rata taxes and insurance; CAM contribution capped at $1.25/SF |
| Base rent | $11.50/SF · $437,000/yr through Aug 31, 2029 |
| Step | $12.08/SF ($459,040/yr) from Sep 1, 2029 through Aug 31, 2034 (5%) |
| Expiration | Aug 31, 2034 (extended early in 2024) |
| Options | Four 5-year options, 5% increase at each |
The arithmetic: ($437,000 + $142,500) ÷ $17,100,000 = 3.39%. The $142,500 is the anchor's share of taxes, insurance and capped CAM (page 08).
One anchor, eleven paying shops, two open bays, and every lease drawn to its last day.
| Suite | Tenant (sample) and use | SF | Rent/SF | Annual base rent | Expiration | ’27’28’29’30’31’32’33’34 |
|---|---|---|---|---|---|---|
| A | Cumberland Fresh Market · Grocery anchor | 38,000 | $11.50 | $437,000 | Aug 31, 2034 | |
| 101 | Pike Street Chicken · Quick-service, drive-thru endcap | 2,800 | $34.00 | $95,200 | Mar 31, 2033 | |
| 102 | Polished Nail Lounge · Nail salon | 1,400 | $22.00 | $30,800 | Jun 30, 2028 | |
| 103 | Hermitage Insurance Group · Insurance agency (national-carrier agent) | 1,200 | $21.00 | $25,200 | Dec 31, 2027 | |
| 104 | VACANT · Second-generation retail | 1,200 | ($23.00 market) | n/a | n/a | |
| 105 | Cocina Stones River · Full-service Mexican restaurant | 2,600 | $20.00 | $52,000 | Sep 30, 2030 | |
| 106 | Wireless store (carrier franchisee) · Mobile / wireless | 1,600 | $24.00 | $38,400 | Jan 31, 2029 | |
| 107 | Stones River Family Dental · Dental office | 2,400 | $23.50 | $56,400 | Jul 31, 2031 | |
| 108 | Cutline Barber Co. · Barber | 1,000 | $22.60 | $22,600 | Apr 30, 2028 | |
| 109 | Pizza carryout (franchisee) · Quick-service pizza | 1,400 | $22.00 | $30,800 | Oct 31, 2029 | |
| 110 | VACANT · Second-generation retail | 800 | ($24.00 market) | n/a | n/a | |
| 111 | Lebanon Pike Taekwondo · Fitness / martial arts | 2,000 | $17.50 | $35,000 | Feb 29, 2028 | |
| 112 | Fresh Press Cleaners & Laundry · Dry cleaner / laundromat | 1,800 | $19.00 | $34,200 | Aug 31, 2030 | |
| 113 | Pike & Pour Coffee · Coffee, drive-thru endcap | 1,800 | $33.00 | $59,400 | May 31, 2034 | |
| Inline occupied · 11 tenants | 20,000 | $24.00 | $480,000 | |||
| Inline vacant at market · 2 suites | 2,000 | $23.40 | $46,800 | |||
| Inline total · 13 suites | 22,000 | $526,800 potential |
$830,232 ÷ 0.0675 = $12,299,733, rounded to $12,300,000.
$12,300,000 ÷ 60,000 SF = $205.00/SF. $830,232 ÷ $12,300,000 = 6.750%.
$830,232 ÷ $12,600,000 = 6.589%. $830,232 ÷ $12,000,000 = 6.919%.
What the center earns from November 2026 forward, line by line, with nothing assumed that a buyer cannot check.
| Line | Annual | Per SF (60,000) | Basis |
|---|---|---|---|
| Gross potential rent | $963,800 | $16.06 | Rent roll, vacant suites at market |
| Less: physical vacancy | ($46,800) | ($0.78) | Suites 104 and 110 carried vacant all year |
| Less: credit loss | ($4,800) | ($0.08) | 1.0% of inline occupied rent; no reserve on anchor |
| Net base rent | $912,200 | $15.20 | |
| Expense reimbursements (NNN) | $224,500 | $3.74 | Recovery build, at right |
| Effective gross revenue (EGR) | $1,136,700 | $18.95 | |
| Real estate taxes | ($117,000) | ($1.95) | Sample current bill |
| Insurance | ($33,000) | ($0.55) | Property and liability |
| Common area maintenance | ($96,000) | ($1.60) | Parking lot, lighting, landscaping, repairs, security patrol |
| Management fee | ($45,468) | ($0.76) | 4.0% of EGR |
| Non-recoverable admin / legal | ($6,000) | ($0.10) | |
| Total operating expenses | ($297,468) | ($4.96) | 26.2% of EGR |
| NOI before reserves | $839,232 | $13.99 | |
| Replacement reserves | ($9,000) | ($0.15) | $0.15/SF; roof and parking lot |
| Net operating income (NOI) | $830,232 | $13.84 | Value basis |
Start where the comps trade, then move only for what this center actually is.
Sensitivity · Year-1 NOI $830,232
| Cap rate | Indicated value | Per SF | |
|---|---|---|---|
| 6.50% | $12,772,800 | $212.88 | |
| 6.59% | $12,600,000 | $210.00 | Guidance |
| 6.75% | $12,299,733 → $12,300,000 | $205.00 | BOV |
| 6.92% | $12,000,000 | $200.00 | Floor |
| 7.00% | $11,860,457 | $197.67 |
6.59% and 6.92% are the implied rates at the ends of the range: $830,232 ÷ $12,600,000 = 6.589%; $830,232 ÷ $12,000,000 = 6.919%. The BOV sits between them, at the rate the build above argues step by step.
Six grocery-anchored sales a buyer will put next to your center. October 2025 to August 2026.
Every comp is a grocery-anchored neighborhood center between 55,800 and 72,400 SF in the Nashville MSA and middle Tennessee. $/SF = price ÷ GLA on every row.
| # | Center and address (sample, illustrative) | Submarket | GLA (SF) | Sale price | $/SF | Cap rate | Sale date | Buyer / Seller | Why it is in the set |
|---|---|---|---|---|---|---|---|---|---|
| 1 | Bellevue Commons West 8020 Sawyer Brown Rd, Nashville, TN 37221 | Bellevue | 64,200 | $13,650,000 | $212.62 | 6.55% | Aug 2026 | Private 1031 buyer (California) / Local developer-owner | Stronger Bellevue incomes bought the tighter rate; 41,000 SF regional grocer with 9 years left. |
| 2 | Shute Lane Crossing 5540 Old Hickory Blvd, Hermitage, TN 37076 | Hermitage | 55,800 | $11,100,000 | $198.92 | 6.85% | May 2026 | Regional syndicator / Family trust | Same trade area as the subject; grocer with 6 years left and inline at 88%. |
| 3 | Providence Market Square 1180 N Mt. Juliet Rd, Mt. Juliet, TN 37122 | Mt. Juliet | 72,400 | $15,900,000 | $219.61 | 6.40% | Mar 2026 | DST sponsor / Private equity fund | 2016 build, 12 years on the grocer: the floor of the set. |
| 4 | Bell Road Marketplace 2290 Bell Rd, Antioch, TN 37013 | Antioch | 58,900 | $10,250,000 | $174.02 | 7.20% | Jan 2026 | Local family office / Institutional REIT disposition | 1999 vintage, grocer with 4 years left, inline at 81%: the ceiling of the set. |
| 5 | Sam Ridley Station 640 Sam Ridley Pkwy W, Smyrna, TN 37167 | Smyrna / Rutherford Co. | 61,500 | $12,450,000 | $202.44 | 6.70% | Jun 2026 | Private 1031 buyer (Tennessee) / Developer | Closest analog: regional grocer, 2006 build, inline at 92%. |
| 6 | Nashville Pike Commons 1475 Nashville Pike, Gallatin, TN 37066 | Gallatin / Sumner Co. | 66,000 | $12,800,000 | $193.94 | 6.95% | Oct 2025 | Regional syndicator / Estate sale | Further out with a longer grocer term; estate seller ran a short process. |
| S | Stones River Commons (subject, at the BOV) | Hermitage | 60,000 | $12,300,000 | $205.00 | 6.75% | — | Broker Opinion of Value |
Comp set statistics
| Low | High | Mean | Median | Subject | |
|---|---|---|---|---|---|
| Cap rate | 6.40% | 7.20% | 6.775% | 6.775% | 6.75% |
| $/SF | $174.02 | $219.61 | $200.26 | $200.68 | $205.00 |
| GLA | 55,800 | 72,400 | 60,000 |
Where the subject sits among the six
The subject's 6.75% sits 2.5 basis points inside the comp mean and between its two closest analogs (Comp 5 at 6.70%, Comp 2 at 6.85%). That is where a center with a longer anchor term than Comp 2 and slightly higher inline vacancy than Comp 5 belongs.
Raw prices from $174.02 to $219.61 a foot close to $202.04 to $206.49 once each sale is adjusted to your center.
Adjustment grid · $/SF
| # | Center | $/SF | Location | Vintage / condition | Anchor term / credit | Inline occupancy | Other | Net | Adjusted $/SF |
|---|---|---|---|---|---|---|---|---|---|
| 1 | Bellevue Commons West | $212.62 | −3% | 0% | 0% | 0% | 0% | −3% | $206.24 |
| 2 | Shute Lane Crossing | $198.92 | 0% | 0% | +2% | +1% | 0% | +3% | $204.89 |
| 3 | Providence Market Square | $219.61 | 0% | −5% | −3% | 0% | 0% | −8% | $202.04 |
| 4 | Bell Road Marketplace | $174.02 | +5% | +5% | +5% | +3% | 0% | +18% | $205.34 |
| 5 | Sam Ridley Station | $202.44 | 0% | 0% | +1% | 0% | +1% (parking) | +2% | $206.49 |
| 6 | Nashville Pike Commons | $193.94 | +5% | 0% | 0% | +1% | 0% | +6% | $205.58 |
| Adjusted range $202.04 to $206.49 · median $205.46 | Mean | $205.10 |
The value does not depend on which method you trust.
| Approach | Indicated | Wt. | Weighted |
|---|---|---|---|
| Income NOI $830,232 at 6.75% | $12,299,733 | 60% | $7,379,840 |
| Sales comparison $205.10/SF adjusted | $12,306,000 | 40% | $4,922,400 |
| Reconciled | $12,302,240 | ||
| Broker Opinion of Value (rounded) | $12,300,000 |
Why the weighting. Buyers of grocery-anchored centers price on in-place income and test it against cap rates, so the income approach leads. The two approaches land within $6,267 of each other, which is the point.
Sanity checks
- $205.00/SF sits inside the raw comp range ($174.02 to $219.61), above the unadjusted mean ($200.26) for reasons the grid names, and at the adjusted mean ($205.10).
- 6.75% sits inside the comp cap range (6.40% to 7.20%) and at the comp mean (6.775%).
- Every comp traded inside our range of implied cap rates once adjusted for anchor term and vintage; none requires a story to explain away.
What a buyer sees: the lease-up upside
| Lease 2,000 SF vacancy at market | +$46,800 |
| Added credit loss (1.0%) | −$468 |
| Added recoveries (vacant share) | +$8,200 |
| Added management fee (4.0% of $54,532) | −$2,181 |
| Stabilized NOI | $882,583 |
| Stabilized yield on $12,300,000 | 7.18% |
| Lease-up cost: TI $20/SF ($40,000) + commissions 6% of 5-yr rent ($14,040) + 3 months free ($11,700) | $65,740 |
| Stabilized yield on all-in $12,365,740 | 7.14% |
A buyer at the BOV buys a 6.75% day-one return with a visible path past 7.1% for roughly $66,000 of leasing work.
The buyer's debt lens
Sample assumptions: 60% loan-to-value, 6.25% fixed, 30-year amortization. Re-check rates at launch.
| Loan ($12,300,000 × 60%) | $7,380,000 |
| Equity | $4,920,000 |
| Annual debt service (7.389% constant) | $545,271 |
| Debt service coverage ($830,232 ÷ $545,271) | 1.52x |
| Year-1 cash-on-cash ($284,961 ÷ $4,920,000) | 5.79% |
Reading: leverage is mildly negative at today's sample rates (6.75% cap against a 7.39% loan constant). That is why the buyer pool for this center leans to all-cash and low-leverage 1031 money, and why the marketing plan targets exactly that money.
Ten listings, six grocery-anchored centers, 8.9 offers on average.
| # | Deal (sample) | Location | Property type | SF | Sale price | $/SF | Closed | Days on mkt | % of asking | Offers | Buyer |
|---|---|---|---|---|---|---|---|---|---|---|---|
| 1 | Riverbend Commons | Madison, TN | Grocery-anchored center | 58,400 | $10,950,000 | $187.50 | Q2 2024 | 74 | 101.4% | 11 | Private 1031 buyer |
| 2 | Fairview Village Center | Fairview, TN | Grocery-anchored center | 52,100 | $8,400,000 | $161.23 | Q4 2023 | 88 | 98.8% | 7 | Regional syndicator |
| 3 | Cane Ridge Market | Antioch, TN | Grocery-anchored center | 67,300 | $12,250,000 | $182.02 | Q3 2025 | 69 | 100.0% | 13 | DST sponsor |
| 4 | Spring Hill Corners | Spring Hill, TN | Shadow-anchored strip | 18,600 | $5,850,000 | $314.52 | Q1 2025 | 61 | 102.6% | 9 | Local family office |
| 5 | Lebanon Square | Lebanon, TN | Grocery-anchored center | 71,800 | $11,600,000 | $161.56 | Q2 2023 | 96 | 97.5% | 6 | Regional syndicator |
| 6 | Nolensville Pike Crossing | Nashville, TN | Neighborhood strip center | 24,500 | $6,300,000 | $257.14 | Q4 2024 | 72 | 100.8% | 8 | Private 1031 buyer |
| 7 | Goodlettsville Plaza | Goodlettsville, TN | Grocery-anchored center | 63,900 | $11,150,000 | $174.49 | Q1 2026 | 82 | 99.1% | 10 | Local family office |
| 8 | Clarksville Commons | Clarksville, TN | Grocery-anchored center | 60,200 | $9,700,000 | $161.13 | Q3 2023 | 101 | 96.9% | 5 | Private 1031 buyer |
| 9 | Murfreesboro QSR Pad Portfolio (3 pads) | Murfreesboro, TN | Single-tenant net lease, quick-service | 8,100 | $7,650,000 | $944.44 | Q2 2025 | 54 | 101.3% | 14 | Private 1031 buyers (3) |
| 10 | Dickson Medical Retail | Dickson, TN | Medical-retail strip | 21,000 | $4,950,000 | $235.71 | Q4 2025 | 79 | 99.0% | 6 | Local private investor |
| Ten listings | 445,900 | $88,800,000 | 77.6 avg | 99.7% avg | 8.9 avg |
Read the grocery rows. Six centers between 52,100 and 71,800 SF: the size, the tenancy and the buyer pool of Stones River Commons. We know how regional grocers answer estoppels, how CAM caps change recoveries, and which buyers stretch for a drive-thru endcap.
Read the offers column. Wide lists produce tours; narrow lists produce offers. Ten processes run on named buyer lists averaged 8.9 offers and closed at 99.7% of asking.
Launch January 12. Offers February 18. Close May 5.
Stones River Commons is a 60,000 SF daily-needs center on Lebanon Pike in Hermitage, anchored by a regional grocer that extended its lease early, through August 2034, at a 3.39% occupancy cost. It is 96.7% leased, it offers a 6.75% return on in-place income, and it has a short, visible path past 7.1% by leasing 2,000 SF and marking four renewals to market.
Pricing and guidance
“Offers invited; guidance $12,600,000 (6.59% cap on in-place NOI).” Buyers compete toward the top of the range, not down from it.
Our BOV, $12,300,000. That is where we expect a well-run process to clear.
$12,000,000. Below that, re-tour the two vacant suites with leasing prospects and relaunch with signed LOIs; never chase a buyer down.
Tier 1 buyers get the comp set and the cap-rate build. A buyer who sees the six comps argues inside the range instead of outside it.
Confidentiality agreements signed, by buyer and tier.
Data-room activity by buyer: who opened the rent roll, and when.
The tour schedule, and who is coming back for a second visit.
Pricing feedback, and whether we hold or tighten guidance.
Five buyer types. What each needs, what each will ask, and how each hears about it first.
| Buyer type | Why this center fits them | What they will ask | How we reach them |
|---|---|---|---|
| Private 1031 exchange buyers California, New York, Florida and in-state sellers of apartments and industrial | $12.3M is the right check for a mid-size exchange; the grocery anchor reads as low-management; all-cash or low-leverage money is not hurt by today's negative leverage. | Anchor term and sales; who manages it; can they close inside 180 days. | Direct calls to the 1031 intermediaries and exchange-focused brokers who carry these buyers; a two-page exchange brief with the closing calendar; co-brokerage offered in writing. |
| Regional syndicators Southeast-based sponsors raising $3M to $6M of equity per deal | A Nashville-metro grocer with 7.83 years of term and a lease-up story fits a 5-to-7-year hold; the rollover is their value-add. | Mark-to-market on the four 2027–2028 expirations; capex on the 2007 inline roof. | Tier 1 personal calls from the managing director; underwriting file (rent roll, recoveries, 3 years of operating statements) released on signed confidentiality agreement. |
| Local and regional family offices Nashville, Birmingham, Atlanta, Knoxville | They know Hermitage, they like hard assets they can drive to, and they hold for decades. | Grocer's history at this site; trade-area growth along Lebanon Pike. | Individual meetings in Nashville in Week 1; first tours offered to them. |
| DST sponsors | A single grocery-anchored asset at this size packages cleanly for exchange investors. | Whether 7.83 years of anchor term is enough for their investors (it is at the edge; we tell them so). | Direct outreach to the sponsors' acquisitions desks; data room access on day one. |
| Stretch: grocery-anchored REITs and private-equity aggregators | Below most institutional size thresholds, but one-off buys happen when a center fills a market gap. | Fit with their existing Nashville holdings. | One call each from the managing director. We tell you plainly that this is a long shot, not the base case. |
All-cash and low-leverage 1031 money, because leverage is mildly negative at a 6.75% cap (page 12).
Syndicators read the four 2027–2028 expirations as upside. The lease-up memo is written for them.
Family offices see it first, in person, in Week 1. They tour before the platforms go live.
7.83 years of anchor term is at the edge for DST investors. We say so on the first call.
Seven pieces, each written to answer this center's hard question before a buyer asks it.
| Piece | What is in it | Why it matters for this center |
|---|---|---|
| Offering memorandum print and digital | Investment thesis; aerial and drone photography; site plan with suite numbers; rent roll; anchor profile; recoveries; lease-up upside table; trade-area map and traffic counts; the six comps | Buyers read the anchor page first and the rollover page second. We write both pages to answer the question before it is asked. |
| Two-page teaser | The thesis paragraph, the headline numbers, the guidance, the dates | Goes to all three tiers on launch day. |
| Virtual data room | 3 years of operating statements; current tax and insurance bills; CAM reconciliations; every lease and amendment; grocer sales reports (under confidentiality); survey; Phase I environmental; title commitment; roof and parking-lot condition reports | Opens on signed confidentiality agreement. A complete room on day one shortens due diligence from “please send” to “we have read it.” |
| Grocer estoppel and SNDA, pre-ordered | Draft estoppel sent to the grocer's real estate department the week we are hired | Regional grocers can take 30 days or more to return estoppels. Ordered in November, it is waiting when the buyer needs it in March. |
| Lease-up memo | Leasing interest on suites 104 and 110; renewal conversations with the four 2027–2028 tenants, documented with each tenant's tenure | Turns the buyer's main objection into the buyer's upside. |
| Drone video 60 to 90 seconds | Lebanon Pike frontage, signalized entrance, parking field at a weekday peak | The traffic is the argument; a still cannot show it. |
| Listing platforms | CoStar, LoopNet and Crexi listings launched in Week 1, after Tier 1 has had its first look | Reaches the exchange buyers we do not know yet, without letting the platforms set the first impression. |
Order of release · who sees what, and when
Before launch. Tier 1 courtesy calls: a grocery-anchored center in Hermitage launches January 12.
Launch morning. Teaser to Tier 1 by personal email from the managing director; then Tiers 2 and 3.
Same day. Data room opens as each confidentiality agreement is executed.
Wednesday, Week 1. CoStar, LoopNet and Crexi go live, after Tier 1 has had its first look.
Week 3. Lease-up memo to every buyer who has opened the rent roll.
From launch to close: 16 weeks and 1 day.
A 1031 exchanger must identify replacement property within 45 days of selling. Exchangers whose sales close between Christmas and late January face deadlines from early February to mid-March. February 18 sits in the middle of that window, and May 5 fits inside their 180-day limit.
Eleven stretches of work, each with a date you can hold us to.
Listing agreement Nov 13. Grocer estoppel and SNDA drafts sent Nov 16. Rent roll audit and lease abstracts Nov 16 to 25. Photography and drone on a weekday morning with the lot at peak (first clear Tuesday or Thursday after Nov 16). OM drafted and approved by owner by Dec 18. Data room complete Jan 6. Buyer list finalized and tiered Jan 8. Tier 1 courtesy calls: “a grocery-anchored center in Hermitage launches January 12.”
Launch Tuesday 8:00 a.m. Central. Teaser to Tier 1 by personal email from the managing director, then Tiers 2 and 3. Platforms go live Wednesday. Confidentiality agreements executed and data room opened same day. Family-office meetings in Nashville Thursday and Friday.
First tour block: Tuesday and Thursday, 8:00 to 10:30 a.m. Second round of Tier 1 and Tier 2 calls. Owner's first weekly report: confidentiality agreements signed, data-room activity by buyer, tour schedule, early pricing feedback.
Tours continue. Lease-up memo released to every buyer who has opened the rent roll. Pricing feedback reviewed with the owner; guidance held or tightened.
Final scheduled tour block. Call-for-offers notice sent: offers due Feb 18, with the offer form (price, deposit, due diligence days, closing days, financing contingency, 1031 status, references).
Managing director calls every buyer who has toured: confirms intent, answers the last underwriting questions, flags any buyer whose financing story does not hold. Make-up tours by request.
Offers due Thursday, Feb 18, 5:00 p.m. Central. Offer matrix to owner Friday morning: price, effective price after credits, deposit, hard-money timing, diligence and closing days, financing, buyer's closing history.
Best-and-final round invited from the top three to five offers, due Thursday, Feb 25.
Buyer selected Monday, Mar 1. Purchase and sale agreement executed by Friday, Mar 5.
30 days. Grocer estoppel already in hand. Tenant estoppels delivered by Mar 22. Weekly calls with buyer and owner's counsel. Deposit goes hard Apr 5.
30 days after diligence expires. Prorations and the CAM reconciliation true-up prepared by our team before the closing statement draft.
Approve the offering memorandum.
Review pricing feedback; hold or tighten guidance.
Read the offer matrix, in your hands the morning after offers.
Select the buyer. We recommend; you decide.
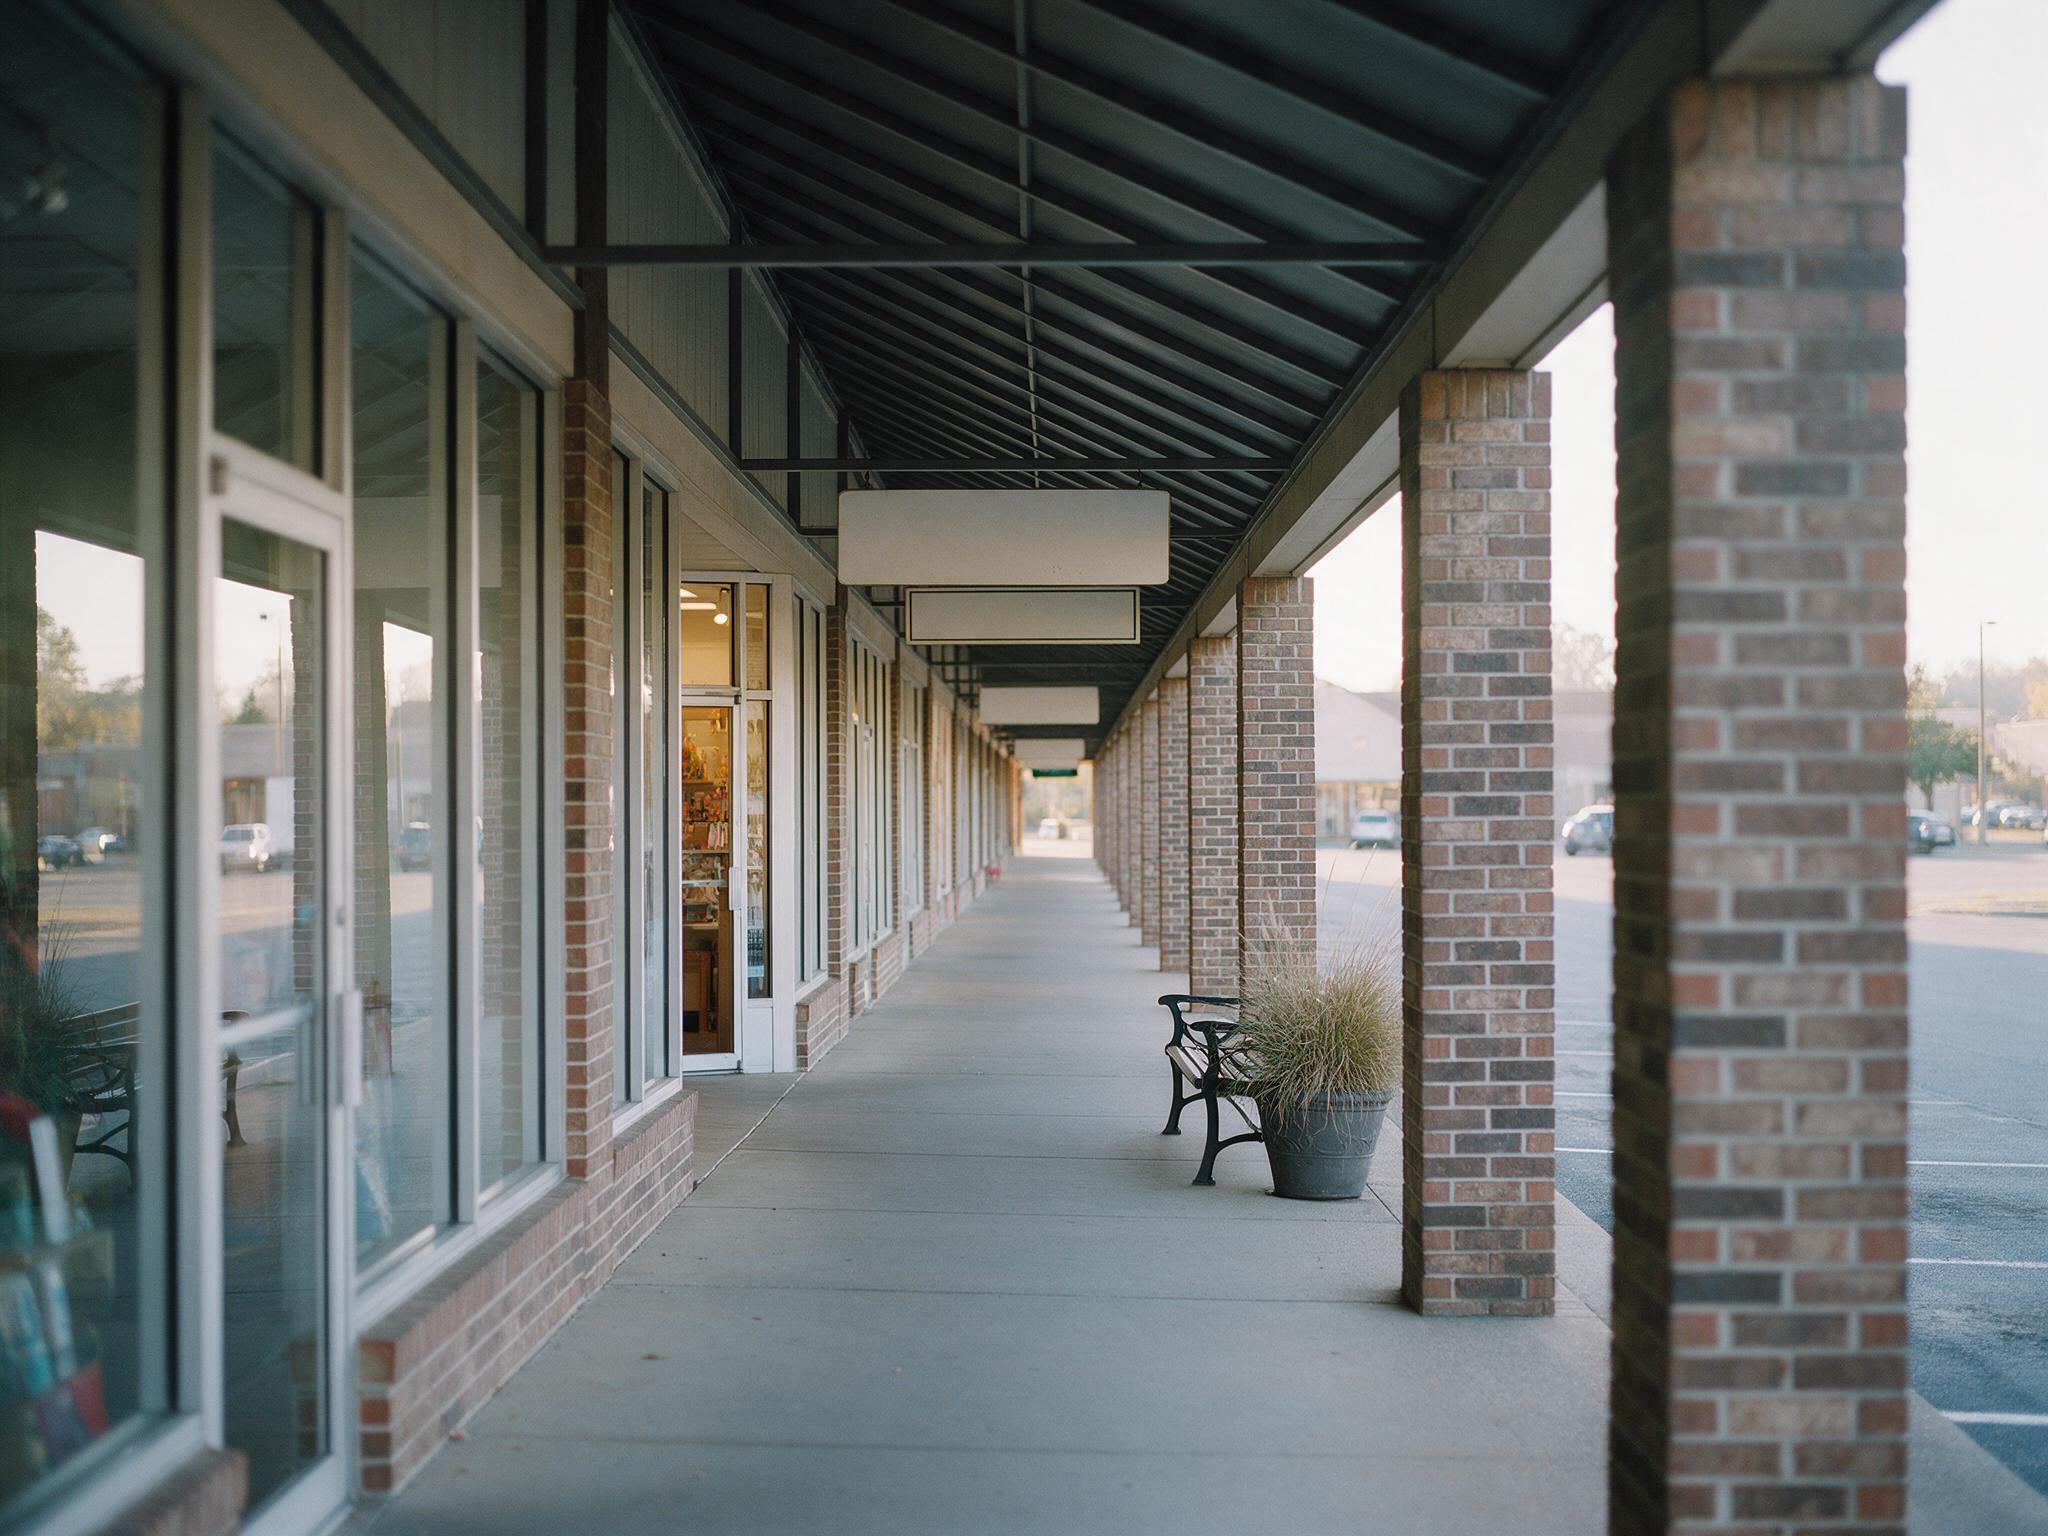
Tuesday, 8 a.m.: inline tenants opening, the grocer calm, the lot showing its commuter traffic. The hour every tour is booked. Rendering; not the subject property.
The managing director leads every tour. No tour is handed to a junior associate.
Tuesday and Thursday, 8:00 to 10:30 a.m. The grocer is calm, the lot shows its morning commuter traffic, and inline tenants are opening rather than serving customers.
The Lebanon Pike entrance and pylon first; the anchor's loading dock and the 2019 roof; the drive-thru endcaps; the two vacant suites, with a floor plan and a leasing-interest sheet in hand; the rear service drive.
Told in advance and never interviewed by buyers without us present. The grocer's store manager is not asked to host; its real estate department hears from us, not from a buyer's phone call.
Offered on a Saturday at noon, so serious buyers see the center at its weekend peak.
Price is negotiated once, at offers, and not again in March.
- 1Offer selection on certainty, not just price. Each offer scored on effective price, deposit size and timing, diligence days, financing, and the buyer's record of closing at the price they offered. We recommend; you decide.
- 2Purchase agreement within five business days of selection, drafted from a form we prepare with your counsel during pre-launch.
- 3Estoppels done early. Grocer estoppel pre-ordered in November; inline estoppels within 17 days of contract.
- 4No surprises in diligence. Roof, parking-lot and environmental reports are in the data room on day one.
- 5A weekly owner report from contract to close, with every open item named and dated.
The person who pitched you runs your deal.
The two firms across the table are good firms. They have national databases, research departments and brand names an owner has heard of. Here is what that does and does not buy you on a $12.3 million grocery-anchored center in Hermitage.
The person who pitches you runs your deal.
At a large shop, a center this size is one of dozens on a team's board. The senior name closes the meeting and an analyst runs the process. At Harpeth, the managing director in this room writes the OM thesis, makes the Tier 1 calls, leads every tour and negotiates the best-and-final. You get the senior person's judgment on every Tuesday in February, not just on this Thursday.
Your buyer list is built for your center.
A large firm's database is wide. Ours is narrow on purpose: about 60 named principals who bought a grocery-anchored center in the Southeast in the last 36 months, sorted by whether they need term, upside or a 1031 deadline. Wide lists produce tours. Narrow lists produce offers. Our sample record: 8.9 offers per listing across ten listings.
Your price is defended with your comps.
Our $12,300,000 rests on six grocery-anchored sales a buyer will put next to Stones River Commons, adjusted line by line, and on an income approach whose every expense and recovery we can show. The two methods agree within $6,267. When a buyer pushes on price, we push back with the same six comps. A desktop number cannot be defended that way, because nobody knows what it stands on.
We fix the hard parts before buyers find them.
The rollover on four inline suites, the original inline roof, the two vacant bays: a buyer will find all three in due diligence and try to re-trade on each. We put them in the OM with the answer beside them, so they are priced once, at offers. And we order the grocer's estoppel in November, because it is the document most likely to delay a spring closing.
We time the launch to the buyers who pay.
A January 12 launch with offers on February 18 meets exchange buyers inside their identification windows. A firm that launches when its own calendar allows misses them.
Specialists in this exact asset.
Six of our ten sample closings are grocery-anchored centers between 52,100 and 71,800 SF: $64.05 million of our $88.8 million. We know how regional grocers answer estoppels, how CAM caps change recoveries, and which buyers stretch for a drive-thru endcap.
- ✓The managing director leads the tours, the Tier 1 calls and the negotiation.
- ✓A weekly written report from launch to close, every Friday.
- ✓The full buyer list, by tier, shown to you before launch.
- ✓The grocer estoppel requested within one week of signing.
- ✓Offers due on a fixed date, February 18, 2027, with the offer matrix in your hands the next morning.
Sample for demonstration only. All figures, the center, its tenants, the comparable sales, the track record and the dates in this book are illustrative samples. They are not a valuation of any actual property and describe no real transaction. The value shown is a Broker Opinion of Value prepared by a licensed real estate broker for listing and marketing purposes. It is not a certified valuation and should not be relied on for lending, tax, litigation or financial-reporting purposes.
The exchange timing described is general market practice, not tax or legal advice; buyers and the owner rely on their own advisors.
Nashville, Tennessee
November 2026 · Sample