Download

Market & entry-economics model (Excel)

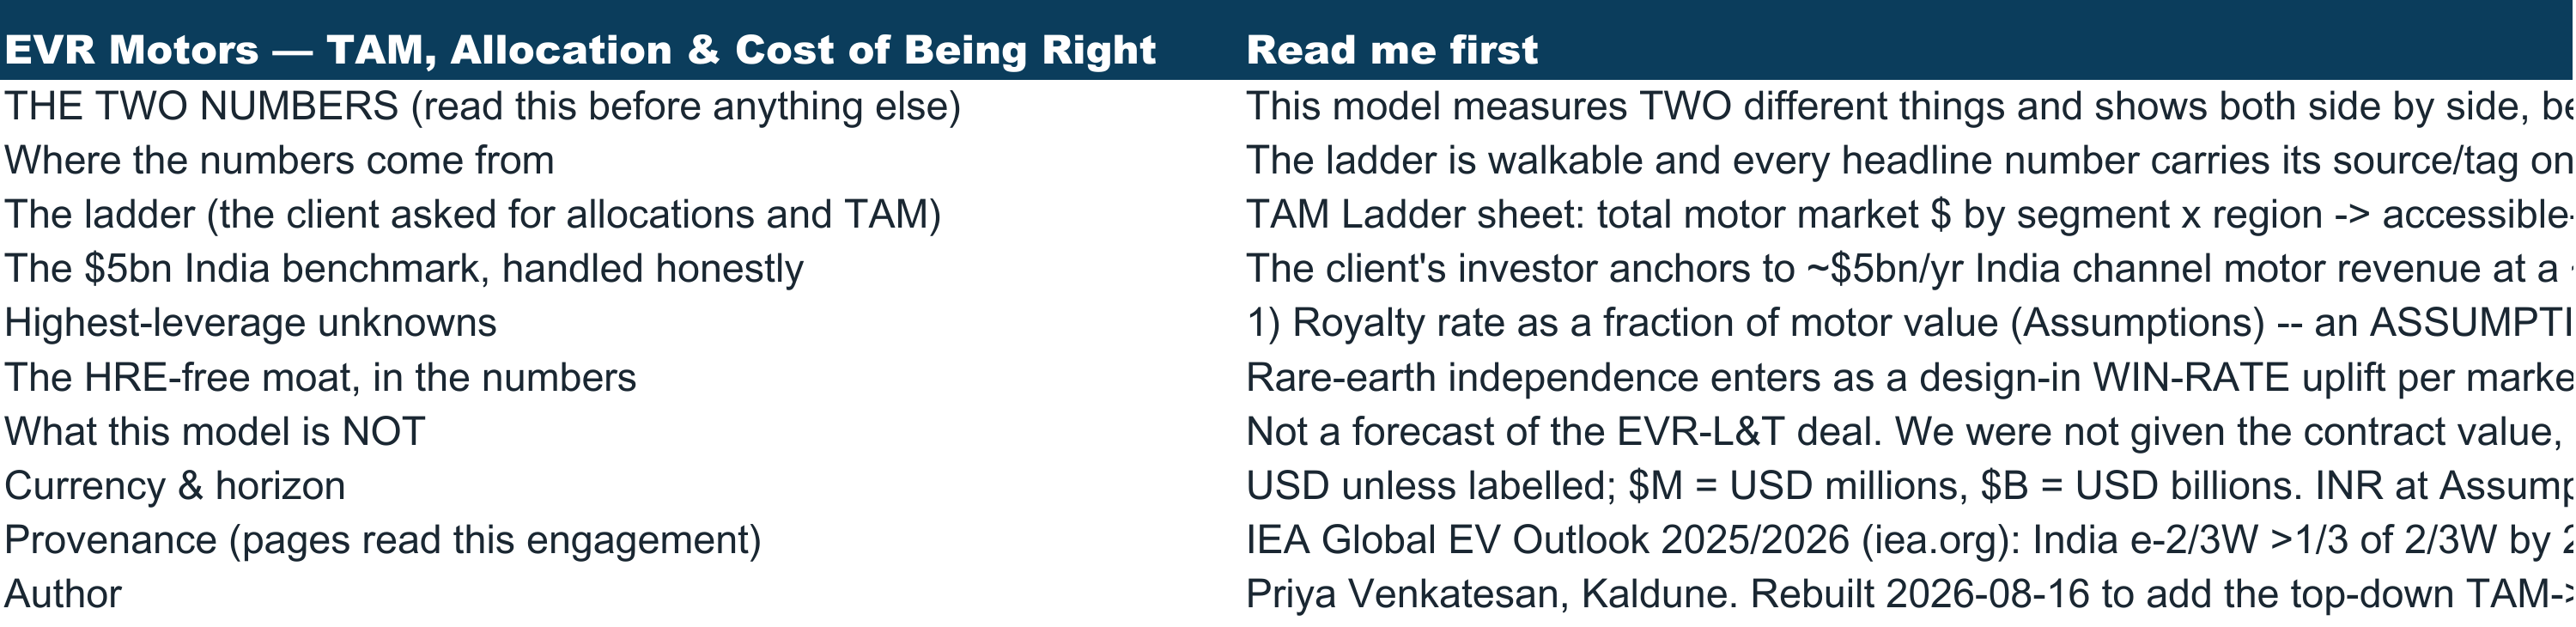
EVR Motors — TAM, Allocation & Cost of Being Right THE TWO NUMBERS (read this before anything else) Where the numbers come from The ladder (the client asked for allocations and TAM) The $5bn India benchmark, handled honestly Highest-leverage unknowns The HRE-free moat, in the numbers What this…
Step TAM (total motor market $) India 2-wheeler India 3-wheeler India passenger + LCV India TOTAL (motor) SE Asia 2/3W Europe MHEV + PV China passenger BEV US passenger BEV PRIORITY TAM (India + SEA + Europe) PRIORITY SAM (India + SEA + Europe) Segment x region -- the whole pie, before EVR can…
Allocation view (of the SAM, what EVR-tech captures) INDIA -- the proven, anchored position (SAM from TAM Ladder H12 area) EVR-tech allocation share of India SAM -- CONSERVATIVE EVR-tech allocation share of India SAM -- BASE EVR-tech allocation share of India SAM -- AMBITIOUS India channel MOTOR…
The two numbers, side by side (India, BASE case, year 5) A. India SAM (reachable motor market, ~2030) B. EVR-tech allocation share of SAM, year 5 (BASE) C. CHANNEL MOTOR REVENUE = A x B ... same, in $B D. Royalty rate (fraction of motor value) E. EVR ROYALTY = C x D Ratio: channel revenue / royalty…
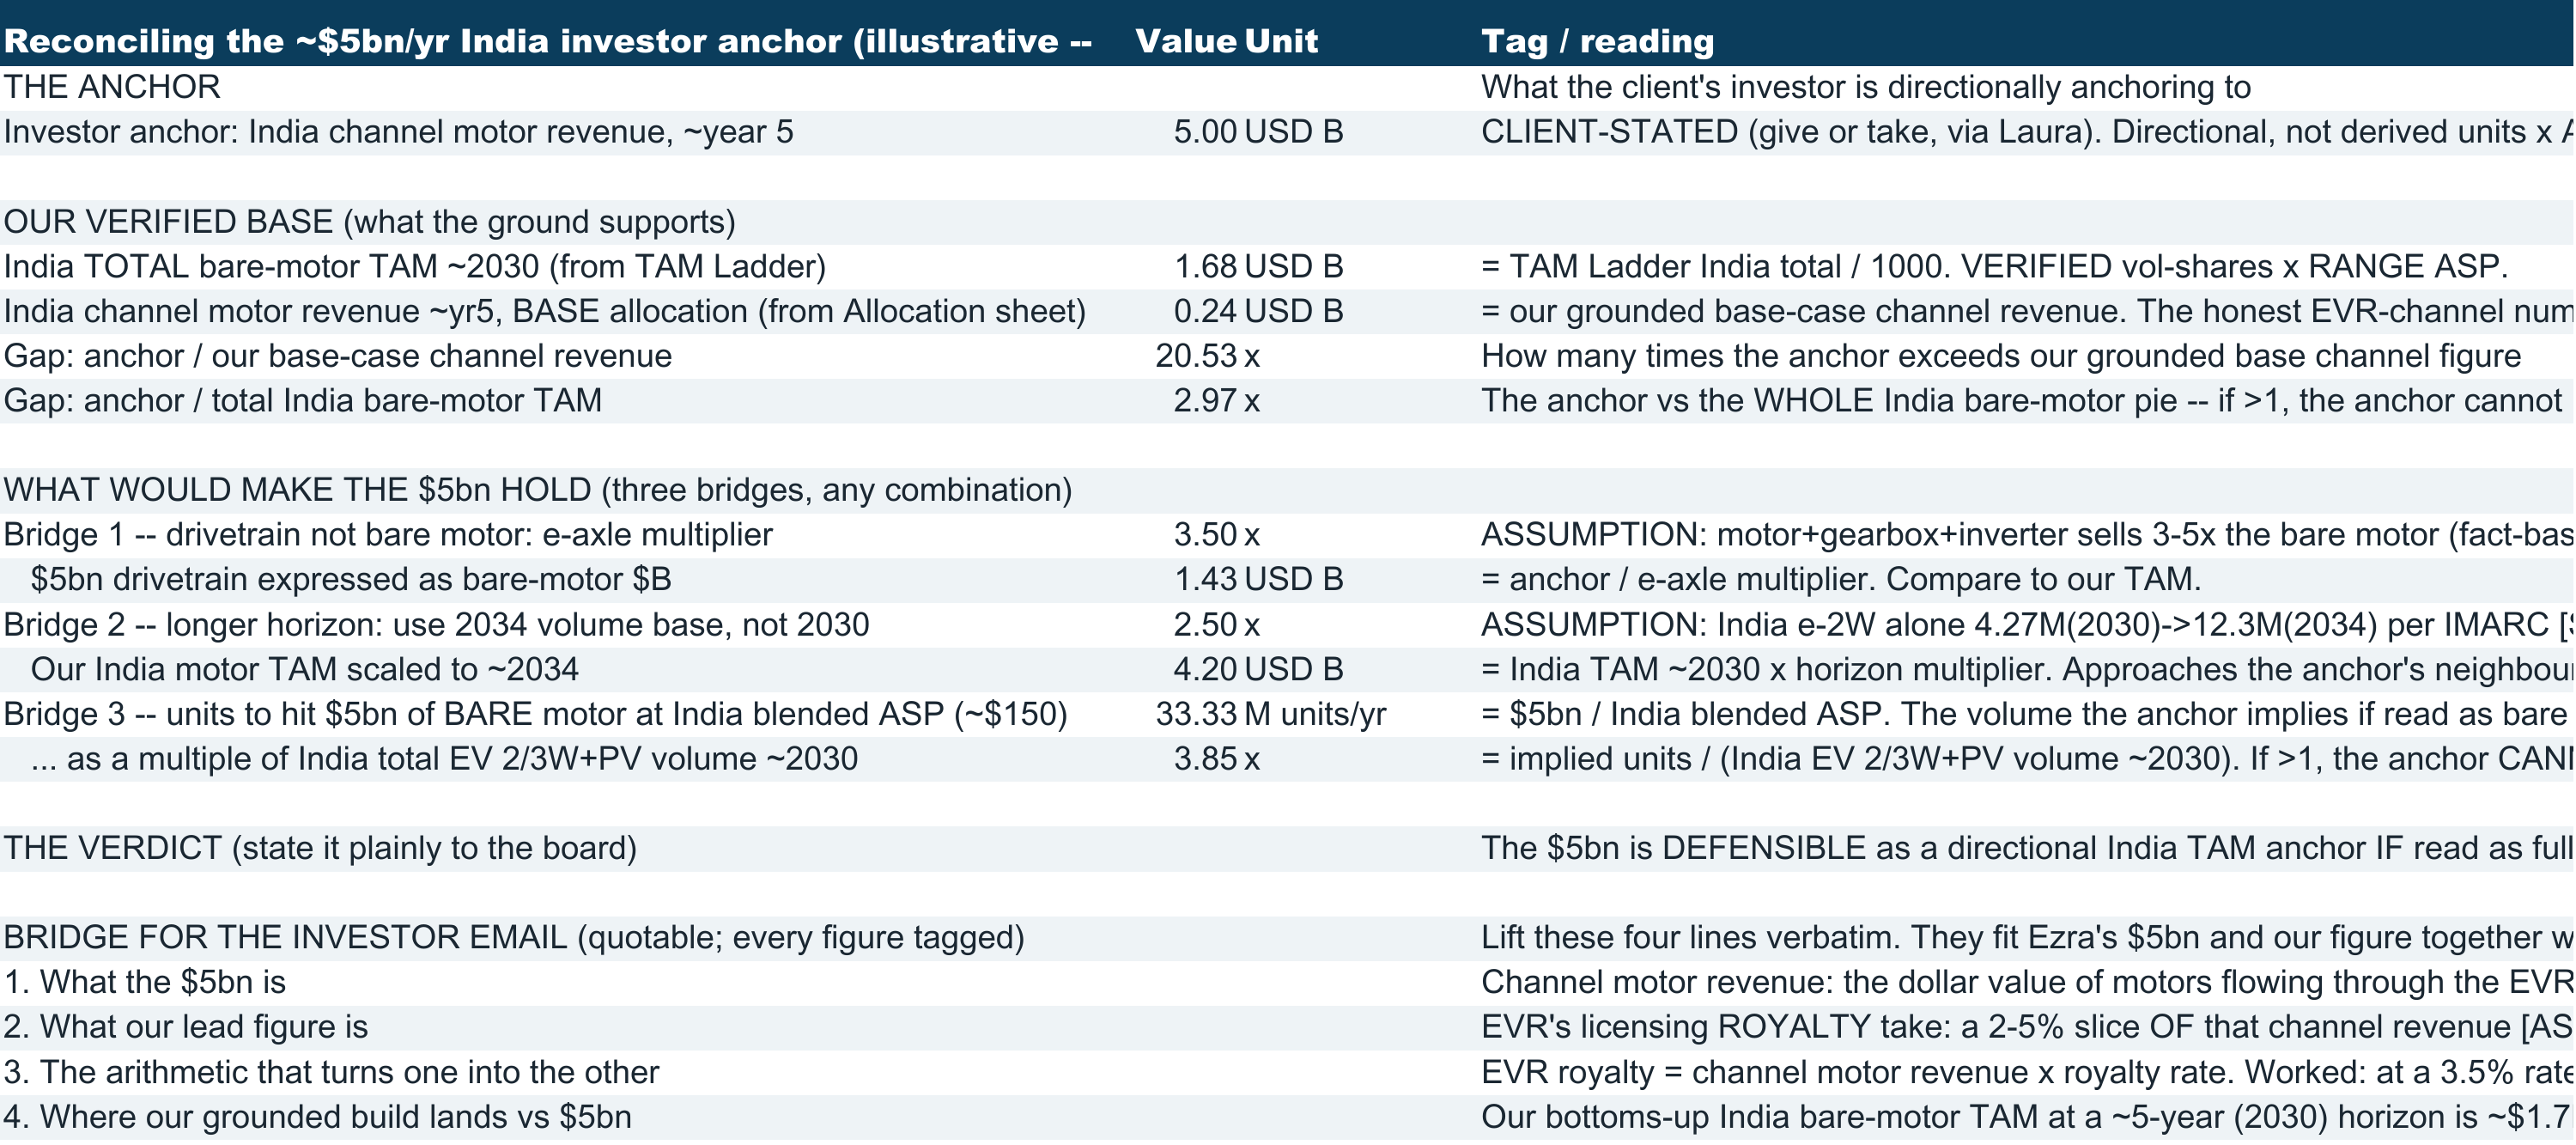
Reconciling the ~$5bn/yr India investor anchor (illustrative -THE ANCHOR Investor anchor: India channel motor revenue, ~year 5 Value Unit 5.00 USD B Tag / reading What the client's investor is directionally anchoring to CLIENT-STATED (give or take, via Laura). Directional, not derived units x A OUR…
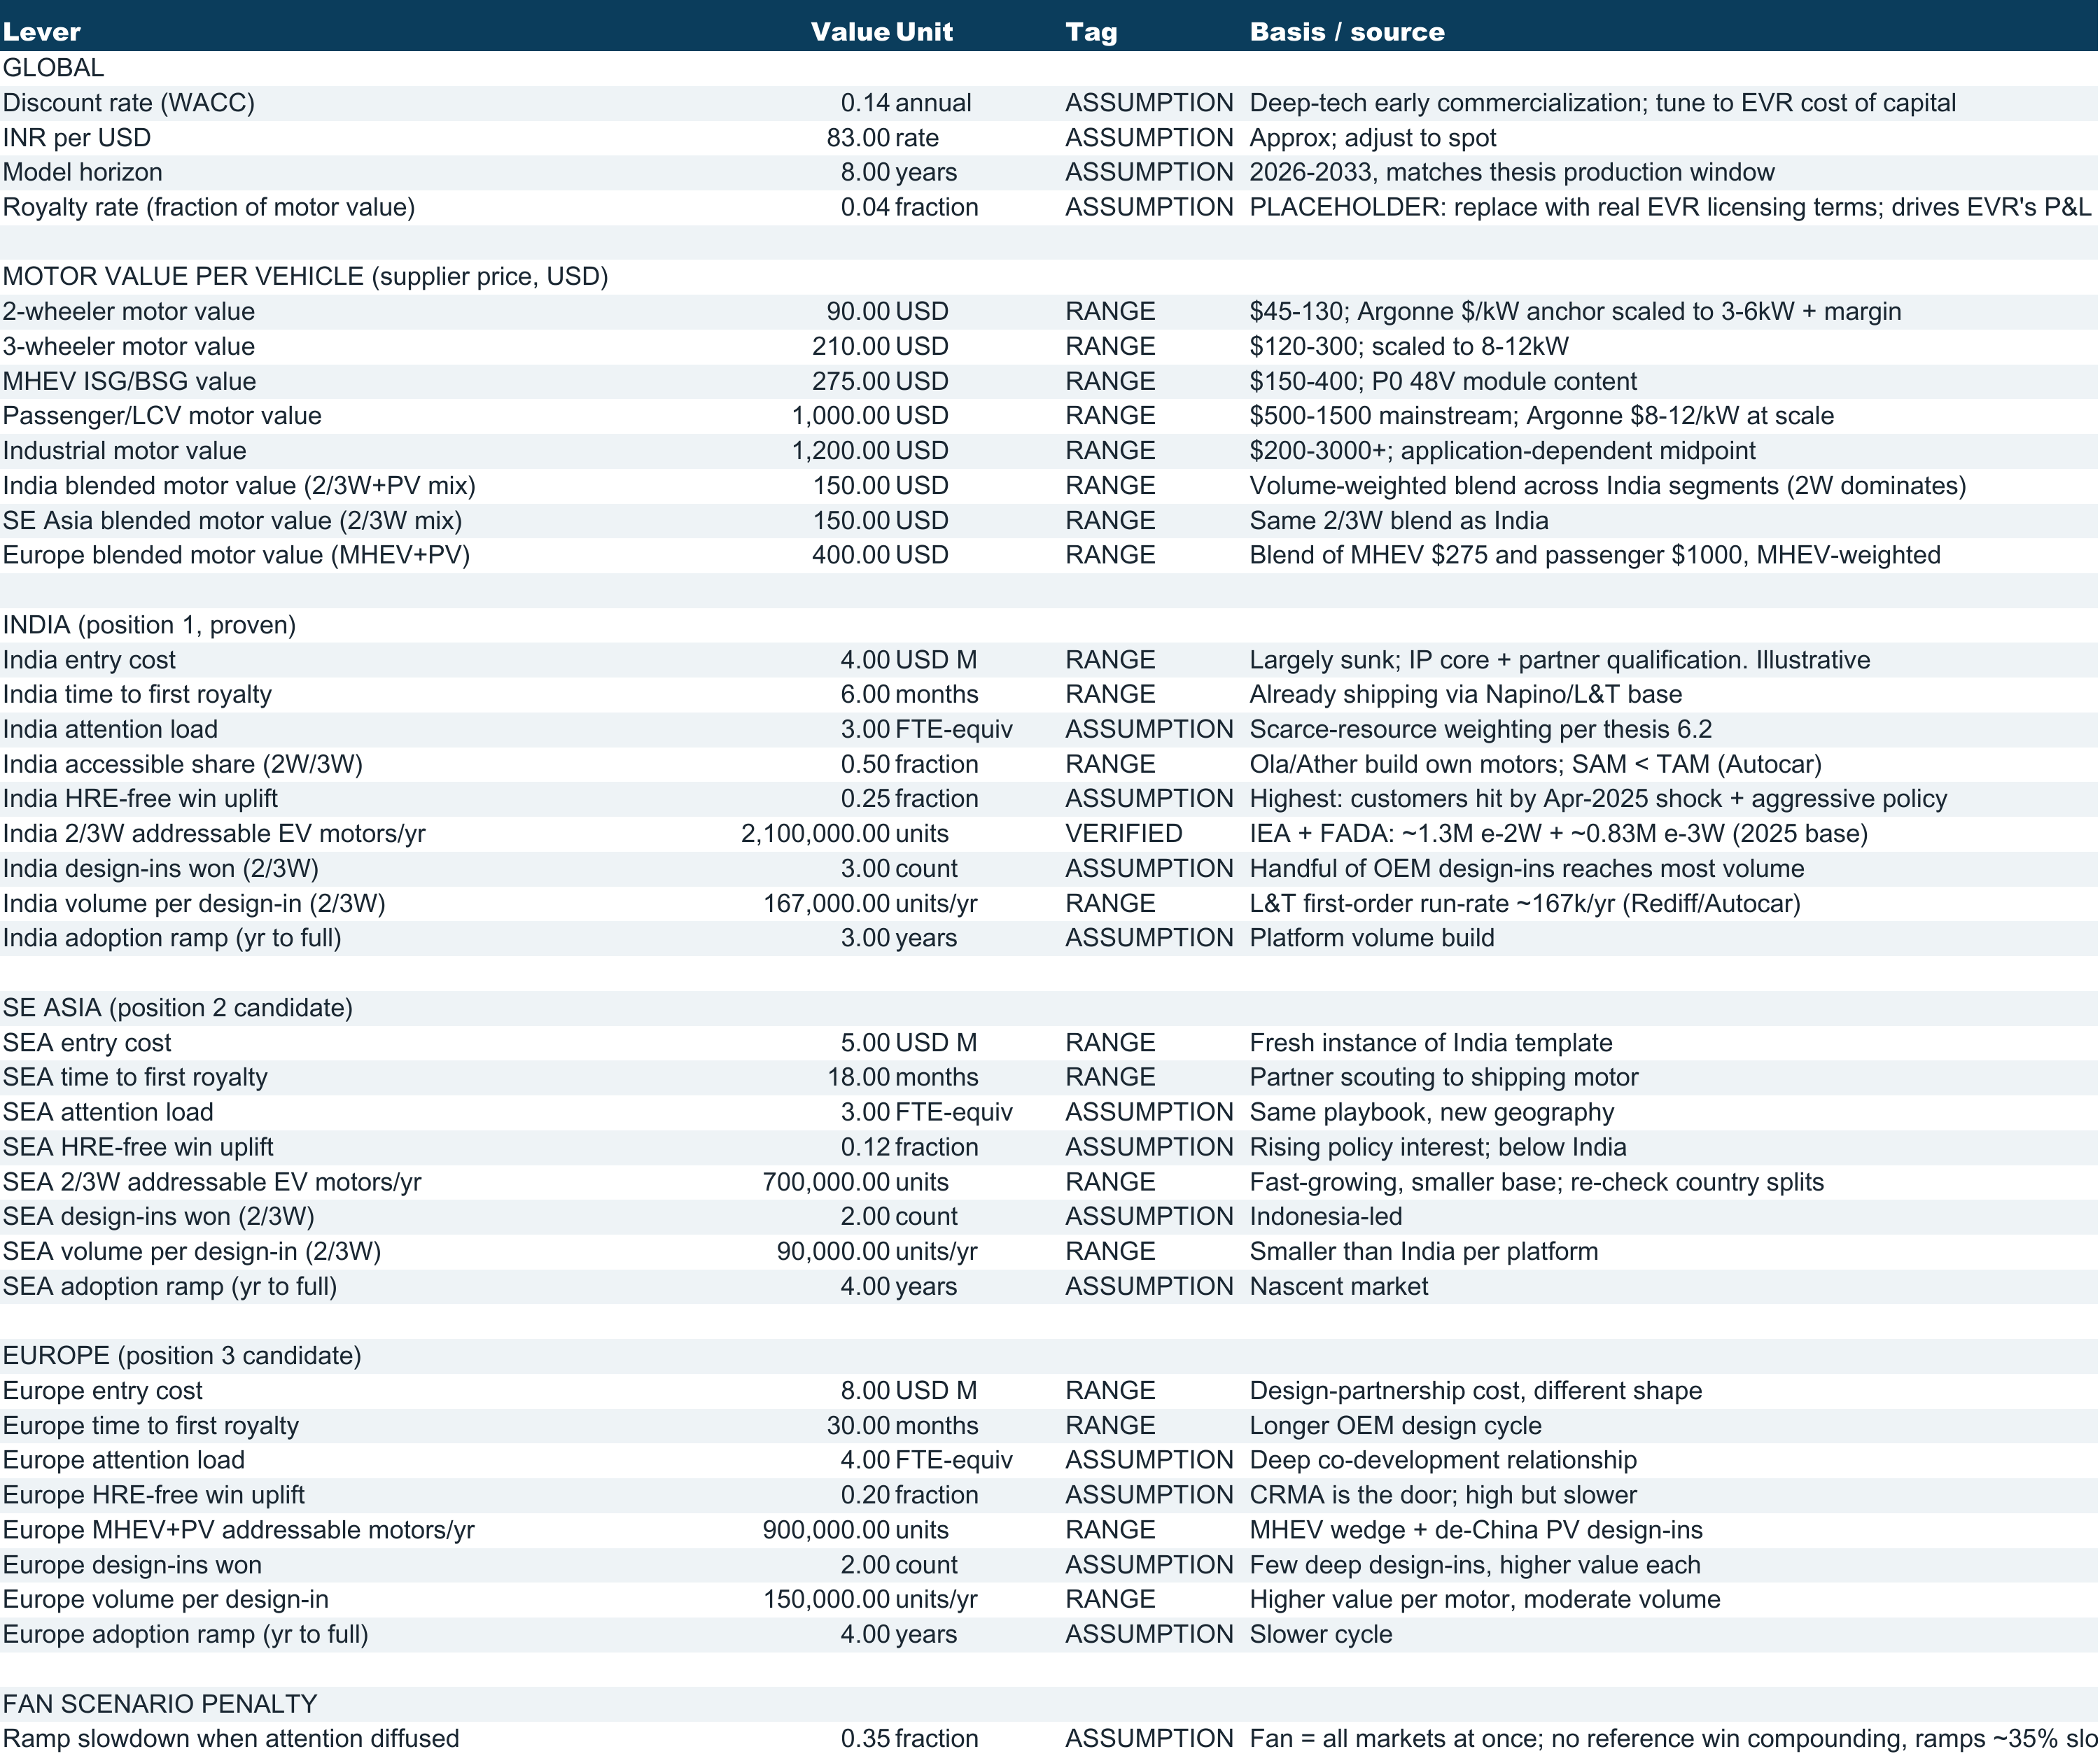
Lever GLOBAL Discount rate (WACC) INR per USD Model horizon Royalty rate (fraction of motor value) MOTOR VALUE PER VEHICLE (supplier price, USD) 2-wheeler motor value 3-wheeler motor value MHEV ISG/BSG value Passenger/LCV motor value Industrial motor value India blended motor value (2/3W+PV mix) SE…
Market (EVR royalty view -- the P&L, not the channel) India SE Asia Europe TOTAL (spearhead, full ramp) Entry cost (USD M) 4.00 5.00 8.00 17.00 Time to royalty (mo) 6 18 30 Attention (FTE) 3.00 3.00 4.00 10.00 Annual channel motor value at full ramp (USD M) 75.15 27.00 120.00 222.15 Annual EVR…
Scenario (equal total spend) Spearhead Fan (all at once) Spearhead advantage Description Portfolio net NPV (USD M) India to reference scale, then SEA, then Europe. Full ramp each, sequenc 6.85 India + SEA + Europe simultaneously. Ramps slowed by the Assumptions p 4.45 Spearhead minus Fan. The…
Question (maps to thesis 6.4) Q1: Cost of a 12-month India royalty slip Q2: Europe vs a second SEA-equivalent market Q3: Royalty rate swing 2% to 5% Q4: Spearhead vs Fan at equal spend Lever moved India royalty NPV re-discounted one extra year vs base Europe net NPV minus SE Asia net NPV Portfolio…